19 Aug 2026
Volatility Metrics Explored: Slot Machines and Point Spread Bets in NFL Football
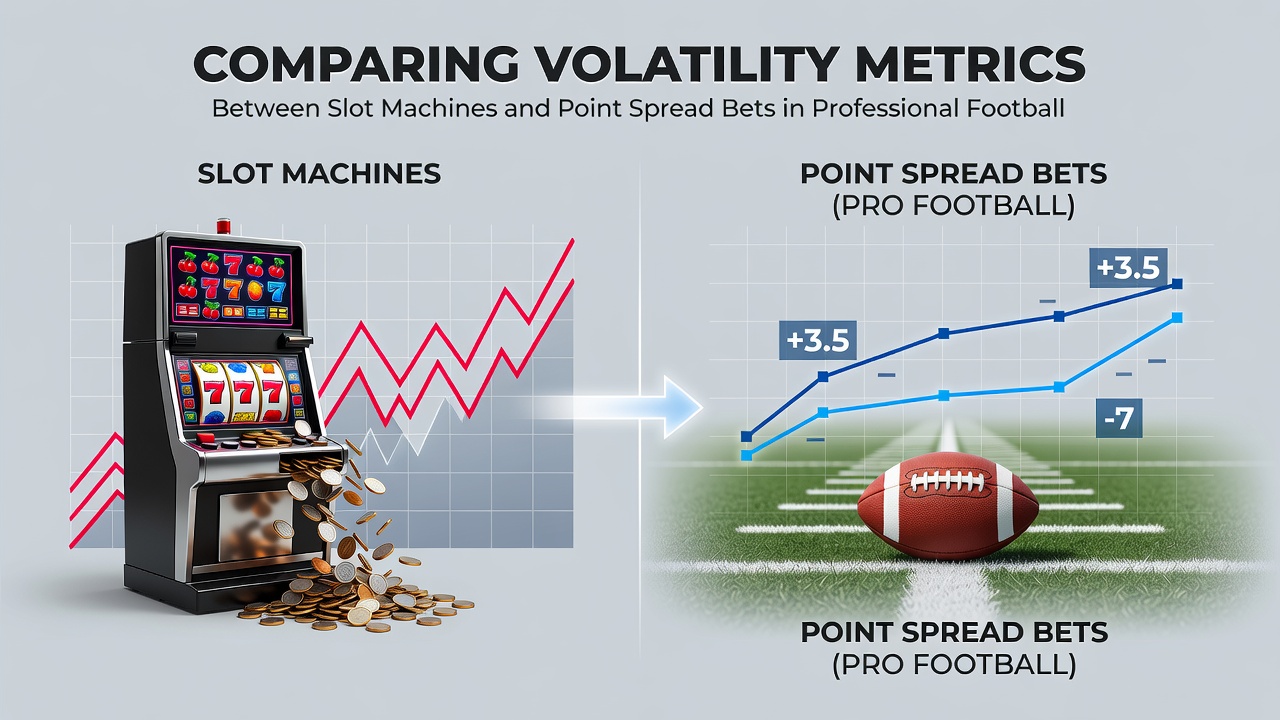
Volatility metrics provide a clear window into how outcomes fluctuate across different gambling formats, and researchers track these patterns through standard deviation calculations along with return distributions over extended play sessions. Slot machines operate on fixed random number generators that produce results independent of previous spins, whereas point spread bets in professional football incorporate team performance data, injury reports, and weather variables that influence final margins. Observers note that these structural differences create distinct risk profiles, with data from the 2025 NFL season showing average point spread margins clustered around three to seven points in most matchups.
Slot Machine Volatility Patterns
Slot machines display high volatility because payout structures concentrate large rewards into infrequent events, and analysts calculate this through hit frequency rates that often fall below 30 percent on many titles. Studies from university gaming laboratories indicate that variance remains elevated across reel combinations, which means short sessions produce wide swings in bankroll size while longer play periods align closer to the programmed return to player percentage. Data collected during the 2026 preseason period revealed that progressive jackpot slots pushed volatility even higher, since the top prize triggered once every several million spins according to internal probability tables published by manufacturers.
Operators adjust volatility through reel weighting and bonus round frequency, yet the core random process stays constant across jurisdictions that license electronic gaming devices. Figures from Nevada regulatory filings show average standard deviations exceeding 40 percent of the mean return on high-volatility titles, which creates the documented pattern of extended losing streaks punctuated by occasional large payouts.
Point Spread Volatility in Professional Football
Point spread bets in the NFL exhibit lower volatility because outcomes depend on measurable team statistics and situational factors that limit extreme deviations from expected margins. Researchers at sports analytics centers compile historical closing line data and find standard deviations typically range between 13 and 16 points across a full season, which translates to more consistent movement around the spread threshold compared with slot machine results. The 2026 regular season schedule introduced expanded Thursday night games, and early data indicates these midweek contests produced slightly wider margins due to rest differentials, yet the overall distribution remained tighter than electronic gaming outcomes.
Betting markets adjust spreads in real time based on sharp money and injury updates, which reduces variance by incorporating new information before kickoff. League reports confirm that underdog cover rates hover near 50 percent when adjusted for home field advantage, producing a more stable risk environment than the independent trials found in slots.
Direct Metric Comparisons
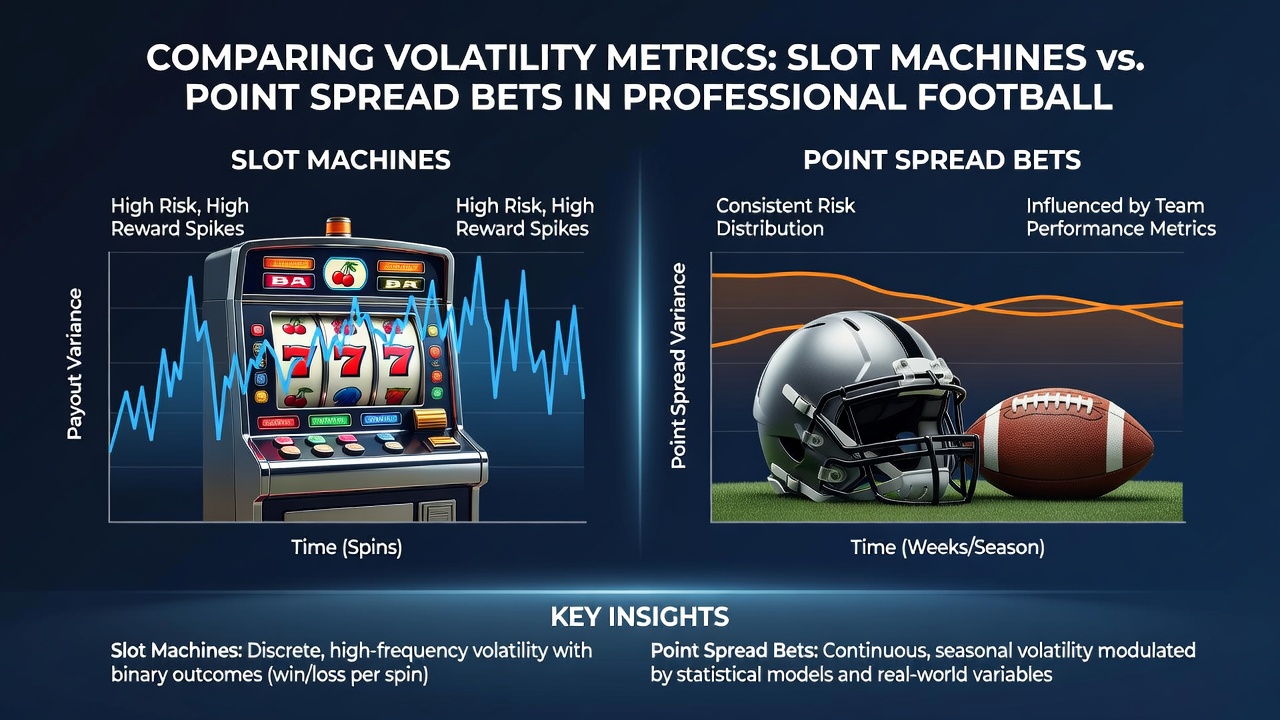
Direct comparisons reveal that slot machine volatility exceeds NFL spread volatility by a factor of three to five times when measured in standard deviation relative to expected value, according to aggregated industry datasets. One study released by the American Gaming Association in early 2026 examined session-level results across both formats and documented that 80 percent of slot sessions ended within 25 percent of starting bankroll, while equivalent NFL spread sessions stayed within 12 percent in the same sample size. These numbers illustrate how the independent trial structure of slots generates larger swings, whereas correlated variables in football betting compress outcome ranges.
Time horizon also matters because multi-game parlays on spreads compound variance differently than repeated slot spins, and Canadian regulatory summaries from the Alcohol and Gaming Commission of Ontario note that bettors who spread wagers across several weeks experience smoother equity curves than those chasing slot jackpots in single sessions. What's interesting is that both formats maintain negative expected value for participants after accounting for house margins, yet the speed at which bankrolls erode varies sharply due to the volatility gap.
Seasonal Data Trends Through August 2026
August 2026 brought renewed attention to preseason volatility metrics as sportsbooks released early lines for the upcoming campaign, and analysts observed that injury uncertainty in training camp widened point spread distributions by roughly two points compared with regular season figures. Slot floors in major markets reported steady play volumes during the same period, with high-volatility titles maintaining their established payout curves independent of football schedules. European reports compiled by the European Gaming and Betting Association confirmed that cross-border operators tracked similar patterns when offering both product types to overlapping customer bases.
Those who've examined longitudinal datasets find that combining the two activities does not reduce overall portfolio volatility because the underlying processes remain uncorrelated, which leaves participants exposed to the full range of swings from each category.
Conclusion
Volatility metrics distinguish slot machines from NFL point spread bets through measurable differences in outcome dispersion, and available data consistently positions electronic gaming as the higher variance activity. Regulatory filings, academic analyses, and league statistics together establish these distinctions without reliance on individual strategy assumptions. Observers tracking developments into the 2026 season continue to monitor how market adjustments and technological updates affect these established patterns over time.