8 Jul 2026
The Role of Statistical Outliers in Shaping Professional Football Betting Tactics Over Multiple Seasons
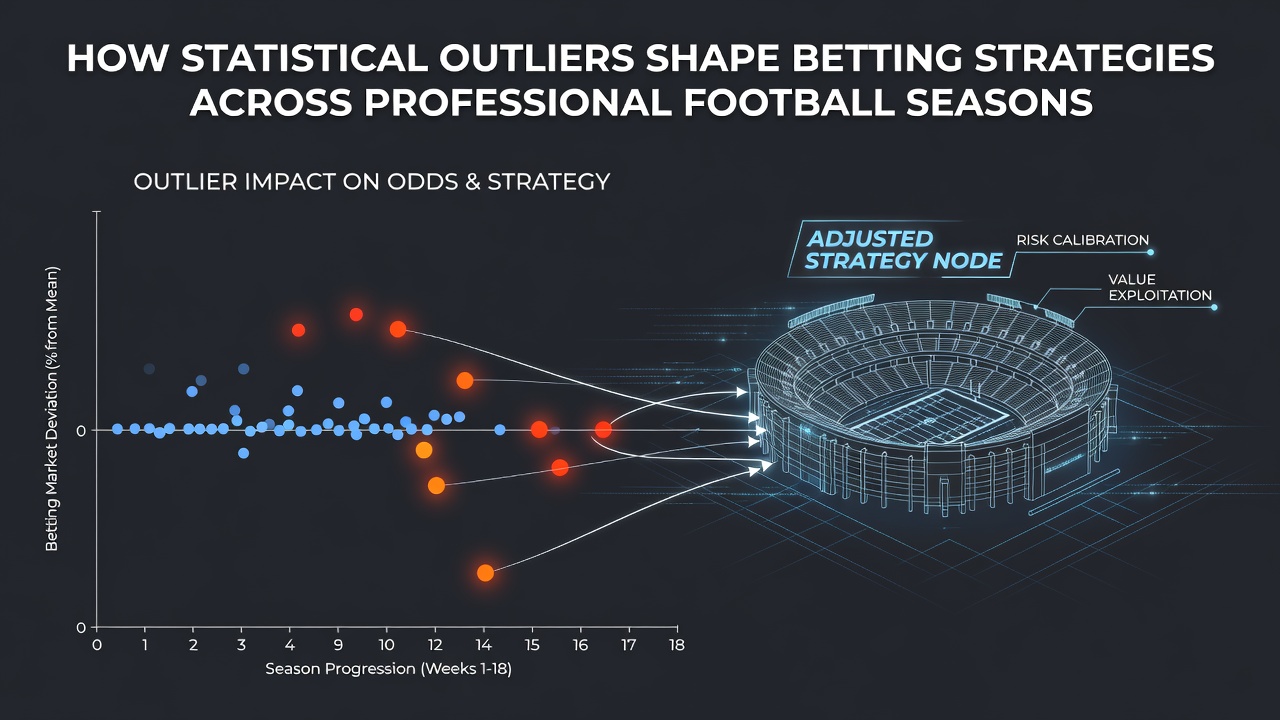
Statistical outliers emerge when individual player performances or team results deviate sharply from established seasonal averages, and these deviations frequently alter how bettors construct wagers across entire campaigns. Professional football generates extensive datasets each year, yet certain games produce results that sit far outside normal ranges, forcing analysts to adjust models rather than discard the data outright.
Defining Outliers Within Football Datasets
Outliers appear most often in metrics such as rushing yards per game, quarterback completion percentages under pressure, and defensive turnover rates. Researchers track these figures through league-wide tracking systems that record every snap, and extreme values surface when a single contest produces numbers two or three standard deviations from the mean. Those who monitor betting markets note that bookmakers initially price lines using median performance trends, yet once an outlier registers, the odds shift to account for the new information.
Seasonal Patterns and Market Adjustments
Early-season outliers carry heavier weight because limited sample sizes amplify their influence on future projections. A running back who gains 200 yards against a top defense in week two may prompt sharp bettors to target over lines on total yards for subsequent weeks until additional data tempers the expectation. Mid-season outliers tend to produce more measured responses, since larger datasets allow clearer identification of whether the result represents a genuine shift or random variance.
Historical Examples Across Multiple Campaigns
One notable case occurred during the 2019 season when a quarterback posted a completion rate above 80 percent in consecutive games, well beyond his career norm. Bettors who recognized the outlier adjusted their approach to player prop wagers, favoring unders on passing attempts in later weeks as defenses adapted. Data from subsequent games showed the completion rate regressing toward the mean, confirming the initial deviation as temporary. Another instance arose in 2022 when a defense recorded five interceptions in a single contest; markets responded by inflating totals for turnovers in that team's next several matchups before settling back once the rate normalized.
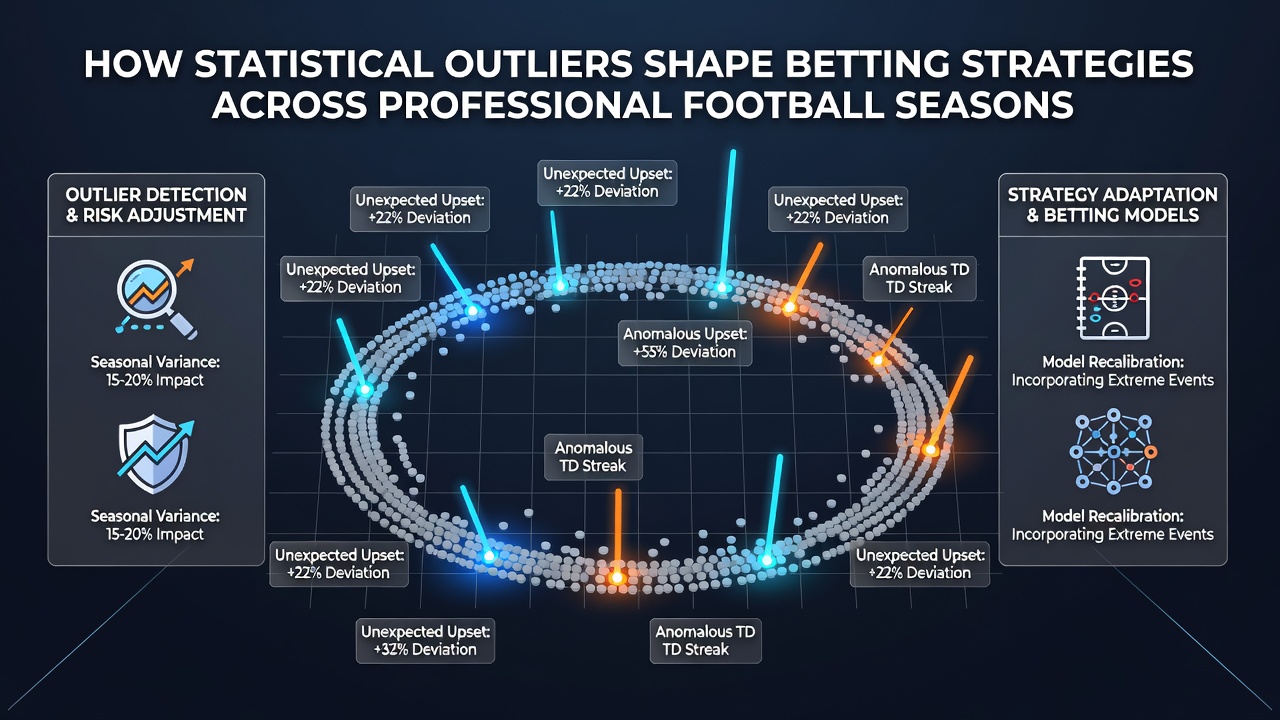
These episodes demonstrate how outliers prompt recalibration rather than wholesale strategy changes. Bettors who maintain detailed records compare current outliers against historical distributions, and this comparison helps determine whether a line offers value once the market has reacted.
Integration Into Model Development
Quantitative approaches incorporate outlier detection through techniques such as z-score calculations and modified box plots applied to play-by-play data. When a model flags an outlier, analysts often run parallel simulations that either include or exclude the anomalous game to measure its leverage on projected outcomes. Teams and independent researchers alike publish findings that show how excluding verified outliers improves forecast accuracy for spreads and totals over full seasons, according to reports issued by the New Jersey Division of Gaming Enforcement.
Implications for July 2026 Preparations
By July 2026, front offices and betting syndicates will review the prior season's outlier events to refine training regimens and draft evaluations. Historical patterns indicate that defenses which posted unusually high sack rates in one year often see those numbers decline the following campaign, prompting adjustments to over/under lines on quarterback pressures. Preseason betting activity in July typically reflects these recalibrations as sharp money targets lines that have not yet incorporated the previous year's extremes.
Conclusion
Statistical outliers continue to influence professional football betting by compelling continuous updates to pricing models and risk assessments. Markets that integrate outlier detection maintain tighter alignment with actual performance distributions across seasons, while participants who track these deviations gain clearer signals when constructing wagers on spreads, totals, and player props.