25 Jul 2026
Mapping the Algorithmic Shifts in Sportsbook Odds During Major League Events
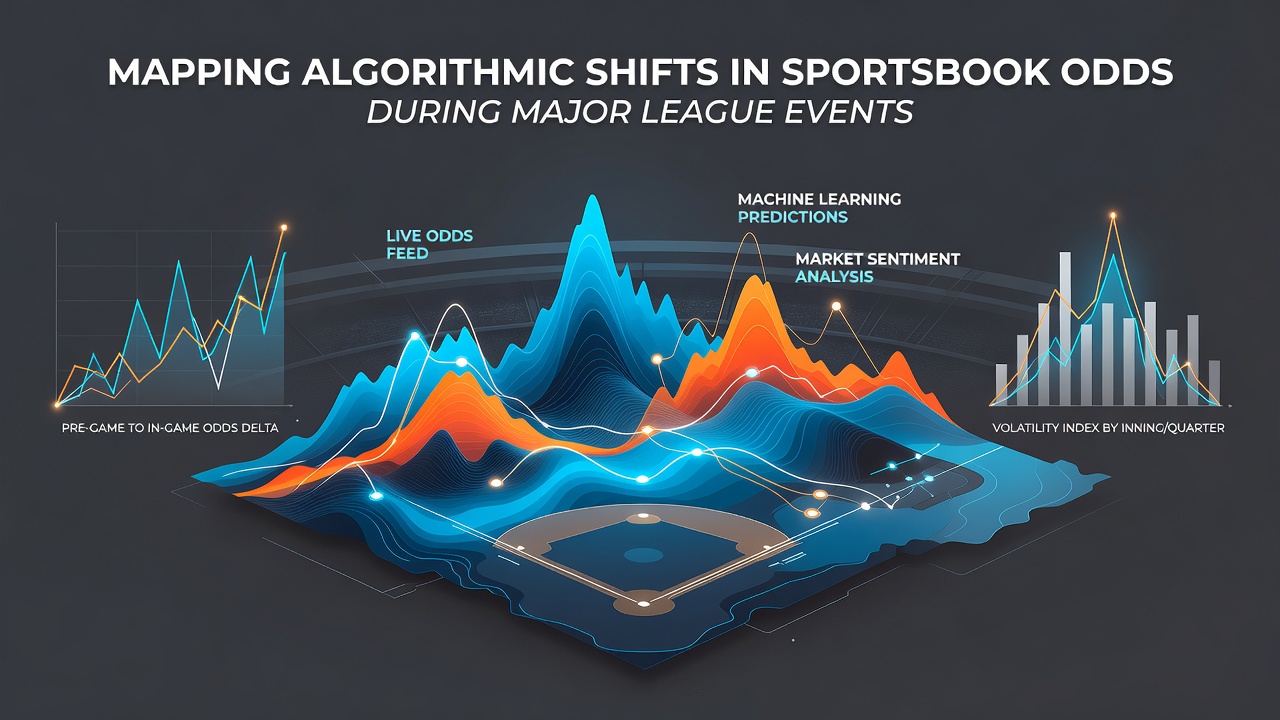
Algorithmic systems in sportsbooks process vast streams of data to adjust odds continuously throughout major league events, and these adjustments reflect betting patterns, player statistics, and external variables that shift in real time. Observers note that during high-profile contests the models recalibrate lines within seconds of new information arriving from official feeds or market activity. Data from multiple jurisdictions shows that odds movement accelerates when sharp bettors place large wagers early, while public money arrives later and triggers secondary corrections.
Core Mechanisms Behind Real-Time Adjustments
Modern platforms rely on machine-learning frameworks that ingest live play-by-play data, injury reports, weather conditions, and historical performance metrics; these inputs feed predictive engines that recalculate implied probabilities every few moments. Researchers have documented how reinforcement-learning layers allow the models to weigh recent outcomes more heavily than older ones during playoff runs or championship series. In July 2026, as MLB teams enter the second half of their schedule, algorithmic updates become especially pronounced around interleague matchups where travel fatigue and bullpen usage create additional variables.
Betting volumes spike when star players exit games unexpectedly, and the systems respond by shifting totals and side lines before human traders can intervene manually. Studies conducted by academic groups in North America indicate that volatility peaks during the final two minutes of quarters in NBA playoff games or the late innings of postseason baseball, periods when models must balance remaining game time against current score differentials and on-base percentages.
Market Influences and Sharp Versus Public Action
Sharp money often originates from syndicates that use proprietary simulations, and when these bets hit the board the algorithms widen or narrow spreads to protect the house margin while still attracting additional volume. Public bettors, by contrast, tend to chase favorites after early scores, prompting the models to move lines in the opposite direction to balance exposure. Figures released by state gaming regulators in Nevada reveal that during the 2025 NBA Finals the average line moved 1.8 points on the spread within the first quarter alone on nights when star guards sat out with reported ailments.
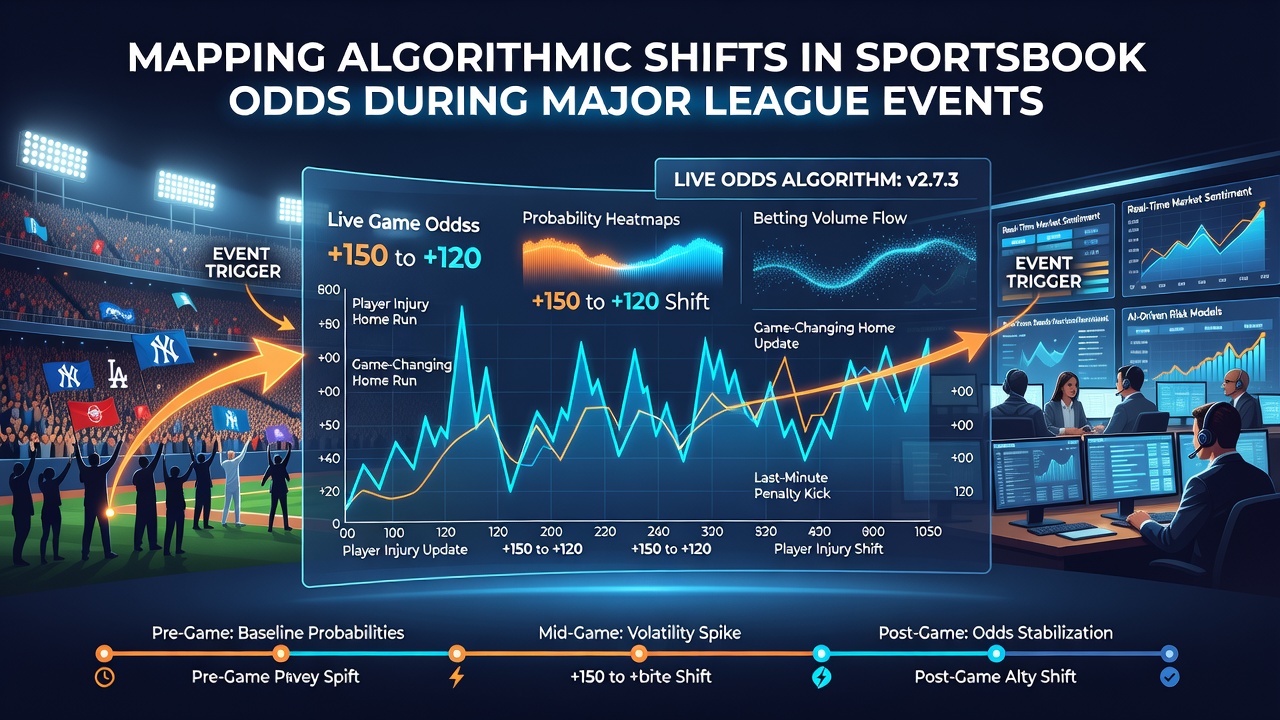
Those who track line history observe that correlated parlays on player props create secondary ripples; when one prop bet receives heavy action the model adjusts related markets such as total points or assists to maintain internal consistency across the entire slate. In the Canadian market, where provincial oversight bodies publish aggregated handle reports, analysts have traced similar patterns during NHL playoff overtime periods where goalie pull decisions trigger rapid updates to both moneyline and goal totals.
External Data Integration and Regulatory Context
Official league APIs supply the raw event data that algorithms require, yet the models also scrape social-media signals and satellite weather feeds to anticipate last-minute changes; a sudden wind shift at an outdoor stadium, for example, can alter over-under totals within the same minute the information reaches the system. National Conference of State Legislatures documentation outlines how several U.S. states now mandate that operators maintain audit trails of every algorithmic adjustment, allowing regulators to review whether lines moved in response to legitimate market forces or other factors.
European research institutions have examined comparable systems used in soccer leagues, where stoppage-time goals produce some of the largest single-minute odds swings recorded in any sport. A 2024 paper from a Dutch university consortium analyzed timestamped betting data and found that algorithmic response times averaged under 800 milliseconds once new event data entered the pipeline. Those findings align with observations from Australian regulatory filings that track similar latency metrics during NRL grand-final coverage.
Patterns Observed Across Multiple Seasons
Longitudinal data collected by industry analysts shows that championship-week volatility exceeds regular-season levels by factors of three to five times, depending on sport and market type. During the 2026 MLB All-Star break period, futures markets on division winners exhibited smaller but still measurable adjustments as teams released updated injury lists and rotation schedules. The same models that handle in-game lines also power these futures, creating cross-market hedging opportunities that further influence live odds when correlated bets arrive simultaneously.
One documented case involved a mid-season trade deadline deal announced minutes before first pitch; the algorithms immediately repriced every affected player prop and adjusted the moneyline within the same update cycle. Observers tracking these events note that transparency around data sources helps maintain market integrity, while delays in official reporting can produce brief windows of mispricing before the models catch up.
Conclusion
Algorithmic management of sportsbook odds during major league events continues to evolve as data pipelines grow faster and predictive models incorporate additional variables. Regulatory frameworks in multiple regions now require detailed logging of each adjustment, creating a growing archive that researchers can use to study market behavior across different sports and seasons. As July 2026 unfolds and additional major-league schedules reach their decisive stages, these systems will process even larger volumes of real-time information while maintaining the balance between liquidity and risk management that defines modern sports wagering.