5 Aug 2026
Data Patterns in Live Event Wagering: Insights from Professional Football Seasons
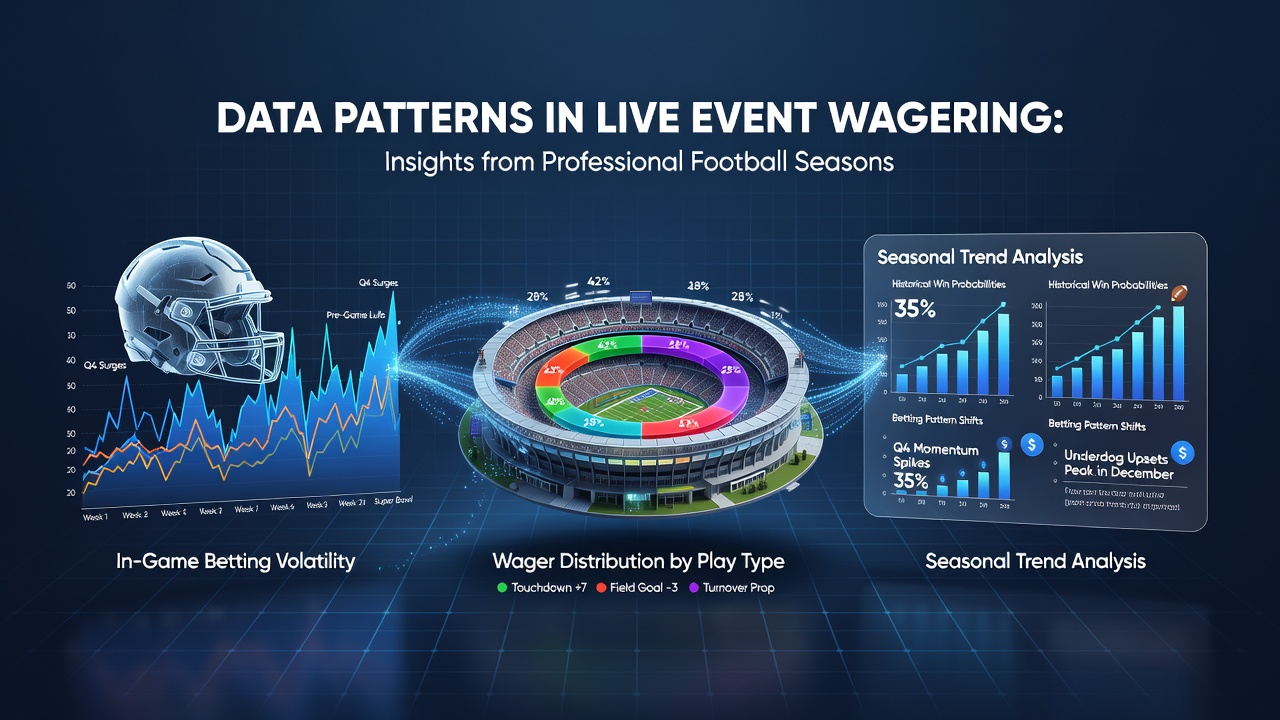
Live event wagering on professional football has generated extensive datasets over multiple seasons, and analysts track how betting volumes shift during drives, timeouts, and scoring plays. Researchers compile these records from regulated markets to identify recurring sequences in odds movement and wager distribution while the 2026 campaign prepares to open in August.
Core Metrics Tracked in Live Football Markets
Operators record time-stamped data on bet placement rates, stake sizes, and market depth for each down and distance situation. Studies from academic institutions show that passing plays trigger faster adjustments in point-spread and total lines compared with running plays, because completion percentages and yardage gains create immediate statistical signals. Observers note that fourth-down decisions produce the sharpest spikes in live activity, since conversion attempts alter expected points in a single play.
Season-long aggregation reveals that home teams receive a measurable share of in-play volume during the first half, yet this pattern reverses in the fourth quarter when trailing clubs attract increased action. Data from multiple leagues indicates that weather conditions at outdoor venues correlate with reduced totals betting after the opening drive, while indoor stadiums maintain steadier volume throughout all quarters.
Seasonal Variations and Drive-Level Insights
Across recent professional football campaigns, early-season weeks display higher volatility in live totals because roster adjustments and scheme changes remain untested. By mid-season the same markets settle into narrower ranges, and late-season data shows increased correlation between injury reports released on game days and subsequent bet flow. Analysts at research centers have documented that overtime periods generate disproportionate activity relative to their duration, with coin-toss outcomes serving as immediate triggers for new wagers.
Drive-level breakdowns further illustrate that sustained time of possession by one side tends to suppress live betting on the opposing total until a change of possession occurs. Those who examine play-by-play logs find that sack frequency and turnover margins produce the most consistent directional moves in moneyline markets once the game enters the final two minutes of each half.
Regulatory Reporting and Cross-Market Comparisons
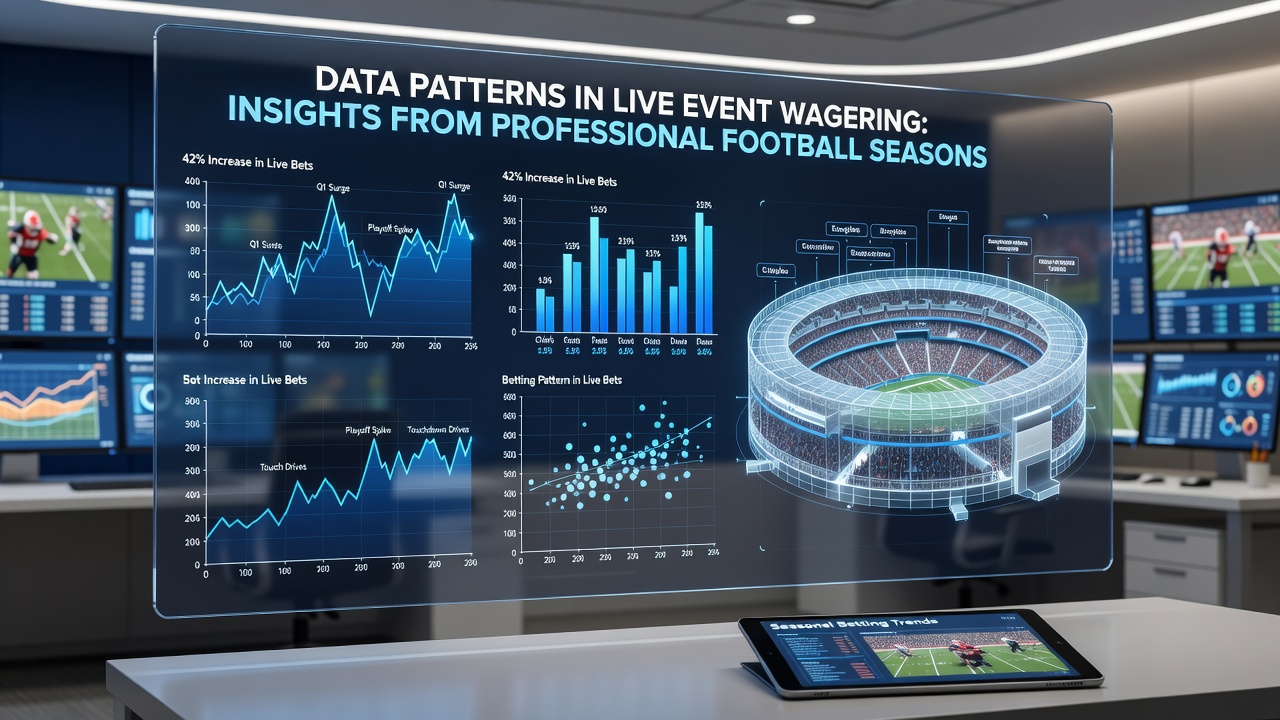
Agencies such as the Nevada Gaming Control Board publish aggregated handle figures that allow comparison of live versus pre-game proportions year over year. Similar disclosures from Canadian provincial regulators highlight comparable growth rates in in-play football wagering, although the share of mobile versus kiosk transactions differs by jurisdiction. University-led examinations of European football leagues provide parallel datasets that underscore how rule variations, such as clock management differences, influence the timing of peak betting windows.
Cross-referencing these sources demonstrates that professional football consistently ranks among the highest-volume live markets during its regular season, with playoff contests producing additional spikes once elimination scenarios become defined. Figures released after the 2025 campaign showed live handle exceeding pre-game totals in several high-profile matchups, a reversal from patterns observed five years earlier.
Technological Influences on Data Capture
Enhanced tracking systems installed in stadiums supply granular inputs that betting platforms incorporate into real-time models. Optical sensors and player-worn devices feed location and speed metrics that update expected points calculations within seconds, enabling markets to reflect current game state more precisely than earlier manual methods. Observers record that the introduction of these feeds coincided with narrower spreads during live windows and shorter intervals between line movements.
Third-party data vendors now supply standardized feeds to multiple operators, which reduces discrepancies across books and allows researchers to isolate true behavioral patterns from platform-specific effects. As August 2026 approaches, several leagues plan expanded sensor deployment that will further refine the resolution of available datasets.
Conclusion
Compilation of live event wagering records from professional football seasons supplies measurable indicators of how play outcomes translate into market reactions. Regulatory filings, academic analyses, and operator logs together establish baseline patterns that evolve with rule changes, technology upgrades, and scheduling adjustments. Continued collection through upcoming campaigns will expand the sample size and permit more detailed segmentation by quarter, weather, and personnel groupings.